

The Migrants' Files
A cross-border investigation counting the human cost of Fortress Europe, with data on thousands of migrants who died trying to reach the continent.
🏆 Data Journalism Award 2014Award-winning data journalist and computer scientist.
I'm an Italian data journalist with a computer science soul. For over a decade I've been mixing algorithms with shoe-leather reporting to tell stories about migration, the environment and the people behind the numbers. Today AI works alongside me at every stage, from scraping and analysis to the code behind the maps. The part no model can do for me is data humanisation: making sure a number never hides the life it stands for.
I'm Chief Data Officer at Code for Africa (member of the Plus alliance), the continent's largest network of civic technology and data journalism labs. My projects have been published by Der Spiegel, El País, The Guardian, Daily Maverick and Internazionale. I've been an ICFJ Knight Fellow, and I train and mentor journalists and communicators across the globe.






A cross-border investigation counting the human cost of Fortress Europe, with data on thousands of migrants who died trying to reach the continent.
🏆 Data Journalism Award 2014
Putting Lagos' floating community of 250,000 people on the map, with drones, canoes and local women trained as mappers. With Code for Africa and the Pulitzer Center.
🏆 Sigma Award 2021
A data-driven documentary on electronic waste in Ghana, with visualisations, scientific sources and on-the-ground reportage.
🏆 Lorenzo Natali Media Prize
An open platform using satellite imagery and AI to map the spread of illegal mining across Africa. With Code for Africa, Earth Genome and the Pulitzer Center.
🛰️ Satellite + AI
An interactive map of Médecins Sans Frontières' search and rescue operations in the Mediterranean, visualising missions that saved thousands of lives at sea.
🌊 Interactive map
A crowdsourced, cross-border investigation into the new wave of young Southern Europeans emigrating after the financial crisis.
📰 Featured on Columbia Journalism Review
An interactive map of deaths in Italian prisons since 2002. Published by The Guardian, it is recognised as Italy's first data journalism project.
🇮🇹 Italy's first data journalism project
A civic tech map of road crashes in Rome, surfacing the city's most dangerous intersections to push for safer streets, built on open data.
🛣️ Civic tech & open data
A data-driven journey across the world's great rainforests, from the Amazon to the Congo Basin to Indonesia.
🌍 Published in six countries
A data-driven journey through Italy's hydrogeological fragility, where landslides, floods and coastal erosion threaten 94% of the country's municipalities.
✦ Made with Fable 5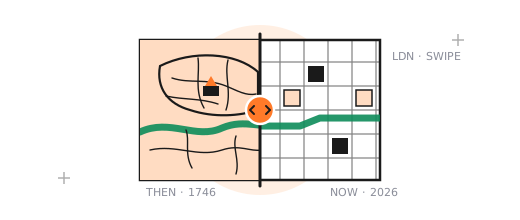
Old maps, laid over the cities they became. A tool that stretches 41 georeferenced historical sheets, from 1550 to 1966, onto the live maps of eight cities, from London to Mexico City, so you can fade or swipe between past and present.
✦ From the Plus AI Sprint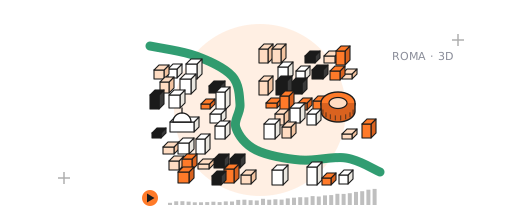
Every building in Rome, some 250,000 with the Vatican inside, in 3D and coloured by age and historical context. Italy keeps no register of when its buildings went up, so the dates are pieced together from open data: the region's building survey, the census, Wikidata and more, with each building's card saying which source dated it. Press play and watch the city grow.
🏛️ After Alex Barakov's Amsterdam map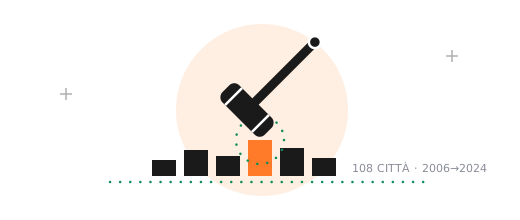
A civic tool on reported crime in Italy's 108 provincial capitals, from 2006 to 2024, built on official ISTAT and Eurostat data: where the most and the fewest crimes are reported, what is rising and what is falling, where sudden spikes hit, alongside how safe people feel. A search opens the profile of any Italian municipality, and six deep dives go further: prisons, deportations, perception, unsolved crimes, minors and pre-trial detention.
⚖️ Official data, city by city
AI now sits inside every stage of the pipeline, from single prompts to agentic loops. Building Italia Fragile, the journalist becomes less a hands-on builder and more an orchestra conductor.
How generative AI turned two multi-week data visualisation builds into a matter of days, and what that means for the craft.


How a community-led mapping project put one of Lagos' largest informal settlements on the map, with drones, canoes and open data.

I'm always up for collaborations, talks, trainings and ambitious cross-border projects. Let's talk.